


This time-lapse video by Jay Gordon visualizes all 16 million transactions made by the 3.1 million Oyster card users across the city of London in one 24 hour period. The brightness of each pixel represents the number of people in one of three categories. The blue pixels indicate the presence of cardholders either before their first transaction of the day or after their last (assumed to be at home). The green pixels represent passengers in transit, using either bus, rail or tube. The red pixels indicate travelers between transit journeys, whether transferring, traveling outside the transit system or engaging in activities such as working or shopping.
The video was shown by Gareth Sumner of Transport for London (TfL) as part of a recent event hosted by the Urban Design Group (UDG) in London. The event, entitled ‘Smart Phones and Urban Life’, was based on the premise that “the smart phone will have as much impact on towns and cities as the motor car.” WIth speakers from an array of backgrounds, the event aimed to explore how new and rapidly evolving technologies can be employed in urban life and design.
Fellow Land8 writer Jeff Gonot has already been blogging about the emerging phenomenon of Big Data in his three part series ‘Big Data to Big Design’ (read Part One and Part Two here). At the UDG event, Gareth Sumner explained how TfL are using analysis of big data to better understand the daily flow of London and ultimately to improve the experience of every traveler within the city.
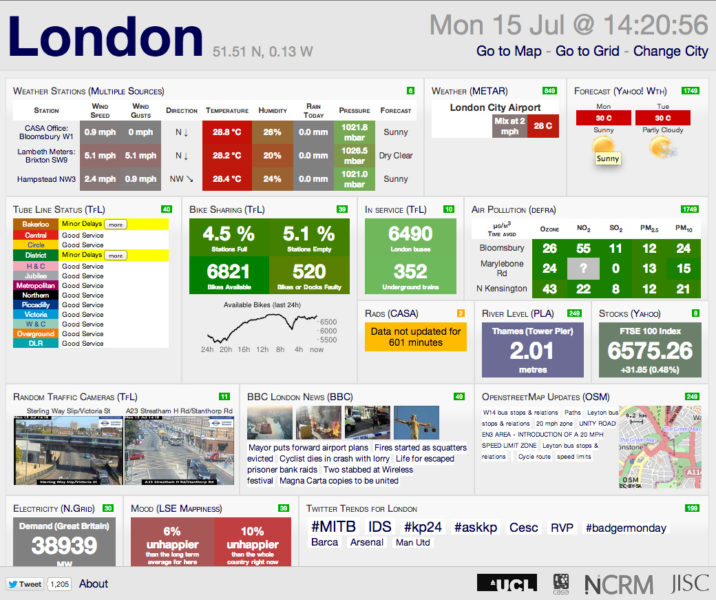
Big data in the city of London exists in a multitude of entities. From GPS mobile phone signals to Oyster card journey information to Barclays cycle hire statistics and climate sensors, the data is out there and most importantly; it’s free. Websites such as City Dashboard make data such as this available for anyone to see. A recent report commissioned by the UK government highlighted the need for public sector data to be open and available to everyone. Entitled ‘The Shakespeare Review’ the document stresses the power and potential in being able to combine, analyse, personalise and tailor data.
By sharing and assimilating these vast amounts of intangible data into graphical representations – like the video above – the invisible overlay of digital information that exists in any urban setting evolves into a tangible, understandable entity. Patterns of usage emerge and the ebb and flow of the city becomes more apparent. Understanding these flows and how they relate to urban form allows for the design of more responsive, user-friendly cities.
As well as assisting in the understanding of urban systems on a large scale, real-time data can be communicated to the individual using apps, allowing travelers to make informed decisions about their journeys. This real-time data would be of particular value during big events, such as the Olympics, when large crowds of people could be directed and dissipated around the city with minimum disruption.
But an improved experience of the city is not the only benefit to big data sharing and analysis. In a Deloitte study that was commissioned in parallel to The Shakespeare Review, it was estimated that UK-wide data sharing would generate £1.8 billion (in 2011/12) and that TfL’s efforts in sharing their real-time travel data with customers and app developers has resulted in a time-saving value of £58 million per year for the city of London. The culminated effect of those few precious moments saved by checking the app on your phone for the next available bus equates to considerable financial value. Time is money after all.
The possibilities of big data and the extent to which it could affect the design of the built environment may not yet be fully understood. But one thing is for sure; data gives us increased knowledge. More knowledge allows greater understanding of our environments and the people using them – it allows us to design more extensively and with greater depth. Data is instant and real-time meaning we can test scenarios, measure responses and evolve designs accordingly. The data is out there and we’ve only just begun to scratch the surface.
In my next blog piece I’ll be reflecting on what some of the other speakers at the Smart Phones and Urban Life talk had to say. Could the smart phone really be as influential on towns and cities as the motor car?
Published in Blog


Mitch Howard
Thank you for the great topic and article Helen. This overlay of 21st century digital technology onto 19th century modes of transport certainly is an awkward stage in the evolution of city planning, but it is also very rich in implication. These devices increasingly blur the line between ourselves and our data; or the who we are, what we’re doing, and the where we are doing it (even the term “smartphone” seems a bit dated). So from a not-too-distant perspective, we all become bits of data just looking for the most direct file path. Please understand my small dose of skepticism, as I also fully applaud the creation of a responsive infrastructure. We in Los Angeles have much to learn.