


We live in a technologically driven society filled with bits of information and data. We are the causers, the makers of this data. A definition, provided by IBM:
Every day, we create 2.5 quintillion bytes of data — so much that 90% of the data in the world today has been created in the last two years alone. This data comes from everywhere: sensors used to gather climate information, posts to social media sites, digital pictures and videos, purchase transaction records, and cell phone GPS signals, to name a few. This data is big data.
The colorful image at top depicts word usage on Wikipedia, as users add text. IBM’s Visualization and Behavior Group create these diagrams as a way to visually process the information.
But what does it all mean? Do Facebook posts and Flickr pics actually tell us anything? This three-part series will consider those questions. Part One provides an introduction to big data, while Part Two explores the impact of big data in our society today with an emphasis on design. Finally, Part Three shows the relationship of how big data is or can be implemented in the multi-faceted profession of landscape architecture.
The process of translating large quantities of information and analyzing that data began most notably in 2000. Hal Varian, currently Google’s Chief Economist, started a process to study the amount of information flowing through Google searches. Searches and generated online histories are known as “digital breadcrumbs.” This trail of data that we all produce has proven to be profitable for businesses, politicians and governments, and numerous other market segments. Varian’s study ultimately created Google Trends, which shows the top searched items on Google. More importantly, it shows us the immense store of information (and power) that our digital lives create.
The internet, of course, has been a big reason for the increased growth of big data. When coupled with our ability to go mobile and remain connected to everything through our smart phones, tablets, and laptops, big data grew exponentially. With our lives on display through social media and the constant need to be connected, big data will continue to be a significant part of our lives, for better or worse.
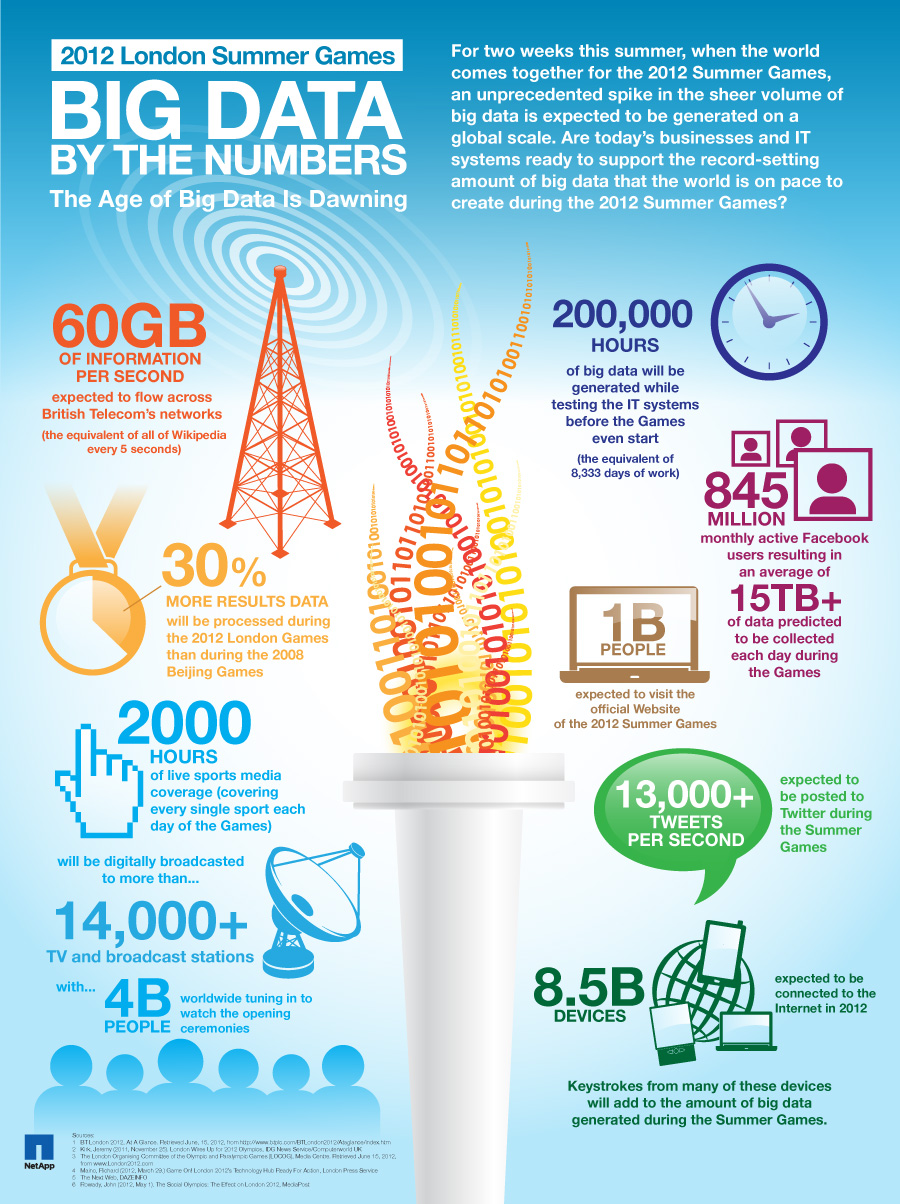
As an example of the sheer amount of information that can be generated, see the infographic below, created by California-based company NetApp, talking about the most recent Summer Olympics in London:
With a general understanding of big data, we can start to see the magnitude of it and the role we play in creating this abundance of information. If you are wondering what this has to do with design and landscape architecture, the next two posts will focus at length on those areas. Check back soon for Part Two, as we delve into the multitude of design applications for big data.
Sources
Published in Blog